Amazon product titles and descriptions affect their sales rank
With an approximate inventory of 12 million units between all the offered categories and services, a usage ratio between US citizens of one per three and a humongous sales income of 17 million dollars EVERY HOUR[1], it is easy to say that selling in Amazon, one of the biggest E-Commerce platforms in the world is a very competitive activity. And well, with an average of 1.6 million [PACKAGES] [2] sold every day last year, salespeople from multiple fields and categories join efforts into optimizing the listing of their products because, at the end of the day, more visits result in the majority of the cases into more sales.
Let’s not forget that when we are using a search tool such as Google to find a product we have in mind, what we are doing is indexing hundreds and thousands of results that already exist on the web. And to top it all, only those who the all-mighty big-data considers worthy of showing to us are the ones that will show up. Let’s also keep in mind that approximately [a WHOPPING 8%] [3] of Google’s users go to the second result page after executing their search.
As part of this article, we’ll analyze how search engine optimization (SEO) can affect product sales in five different categories. We’ll explore these products by finding an overlap correlation between the product’s title & description against the reviews and/or question and compare these results with Amazon’s “best seller rank” or BSR.
Table of Contents
Data Sources
Using the Selenium module and Python, all the data is scraped from hundreds of products listed in Amazon. The titles, descriptions, reviews, and questions are processed using NLTK. Whereas correlations are found using Python’s native library, Counter. After cleaning and processing all our data, we’ve used MatplotLib to visualize it.
Data Analysis
The five categories we’ve decided to analyze are:
- Health & Household
- Kitchen & Dining
- Carry-On Luggage
- Antitheft Keyless Entry System
- Acoustic Guitar Stands & Hangers
We’ll scrap all the data we can from non-sponsored, ranked products. Also, keep in mind that while we can rank products into multiple categories, we’ll only analyze their ranks based on the previous mentions. [Also, we’re limiting the total number of reviews to 60, so our scraper doesn’t take as much scraping products]
To have better results and cleaner data to handle, we’ll be saving our work, non-processed data into JSON, and we’ll scrap our products procedurally:
- Product listings > listing_scraper.py
- Product posts > product_scraper.py
- Product ranking > bsr.py
- Reviews > scrap_reviews.py
- Questions > scrap_questions.py
After this arduous endeavor, it’s now time to process our data!
We’ll use lemmatizer.py to lemmatize and remove stop-words from the reviews and questions for every product. We then run overlapper.py to find the overlap count for the reviews and questions compared against the title and descriptions of the products.
To finalize the process, we run csv_creator.py to get a nice and tidy CSV format list of the products ranking, reviews overlap, and questions overlap.
Analysis results
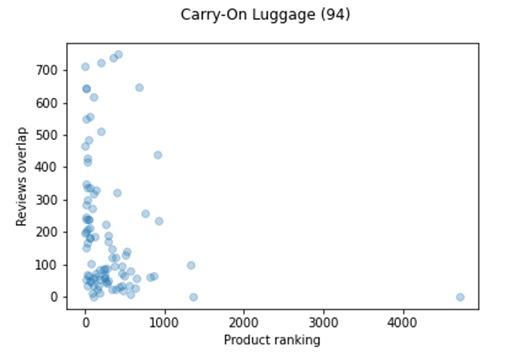
The data visualisation is interesting as it will help find relationships and trends! We will follow the process by using MatplotLib script. Now let us consider our results to explore the correlation between review overlaps under the carry-on luggage products. [The number at the top of our graph represents the amount of products analyzed, keep this in mind!]

Interesting! By looking at this plot, we can spot a linear correlation between the number of overlaps in review and the product ranking; keep in mind that the lower the ranking is, the best. [To have a better grasp of our graph, let’s compare it with the results of our scraper top 10 products under the carry-on luggage category results, in the following table, the -number/numbers- next to the product name refers to the number of reviews and questions analyzed in that product.]

In the carry-on luggage category, we can see some correlation between the amount of overlaps in a product’s reviews and / or questions and its ranking.
What about Health & Household items?

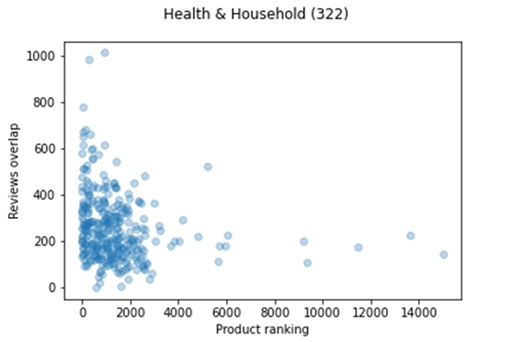
Under this category, we are visualizing 4x more products than what we got to see in the carry-on luggage category. There’s a trend here – a good number of reviews overlap and tend to result in better product ranking. [Again, let’s compare these results with our percentage table!]

Once again, if we ignore a few outliers, we can see that the top 10 products have to partly thank the good SEO implementation for their product ranking, and this is based on our overlap analysis.
Kitchen & Dining Plots

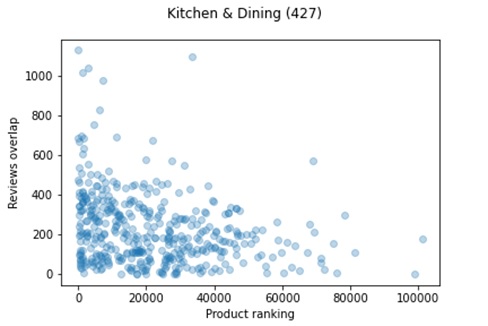
As per this plot, it is easy to spot the spread between rankings and overlaps. Having said that, we can also see that our ranking ceiling is much higher (thirty and ten higher respectively) than our previous plots Will you be able to imagine what’s the result in our percentage table?

Our review overlap percentage is at a much higher rate here. After analysing 427 products under this category, we have seven products that see a 100% overla. With these results, we can be certain that reviews / questions overlap correlates to a higher category ranking!
Summary
After analyzing the visuals, it is safe to say that the reviews and questions overlap. However, this is not always the case. There are also a few products that showcase low or no correlation between their ranking and overlap. Therefore, we can say that SEO for products and titles will help boost the rank of products, but this is not the sole cause of their current ranking.
How can you benefit from SEO?
A well-implemented and analyzed SEO is not the only factor that increases sales for Amazon. SEO is also an extremely vital marketing tool – for E-Commerce, social networks, blogs, or personal/company webpages.
Applying good search engine optimization to your product listings, your webpage, or social network account will boost your exposition to users searching for what you’re offering. The web is an information jungle, and search optimization is a ray of light for businesses, users, and overall sale
How Can MindTrades help?
MindTrades Consulting Services, a leading marketing agency provides in-depth analysis and insights for the global IT sector including leading data integration brands such as Diyotta. From Cloud Migration, Big Data, Digital Transformation, Agile Deliver, Cyber Security, to Analytics- Mind trades provides published breakthrough ideas, and prompt content delivery. For more information, check mindtrades.com.
Please do check https://github.com/Mindtrades-Consulting/Coffee-Shop-Location-Predictor
Related posts
Sidebar
Recent Posts
The Best Forex Brokers for Beginners
Since COVID-19 first popped up, interest in the forex market has increased dramatically. Knowing how to get involved with minimal…
Maximizing Success: The Symbiosis of Dedicated Software Development Teams and Product Design Services
The Symbiosis of Dedicated Software Development Teams and Product Design Services In the rapidly evolving landscape of technology, businesses aiming…


